PRINCETON, NJ -- ÓÅÃÛ´«Ã½Poll Daily tracking for Monday, April 20 through Sunday, April 26 finds that consumers' mood has become slightly more negative, compared to the positive surge of the previous week, and that consumer spending remains weak; at the same time, the data suggest the deterioration of job-market conditions has eased a little during the past couple of weeks.
(Maximum possible value of 200; minimum possible value of -200)
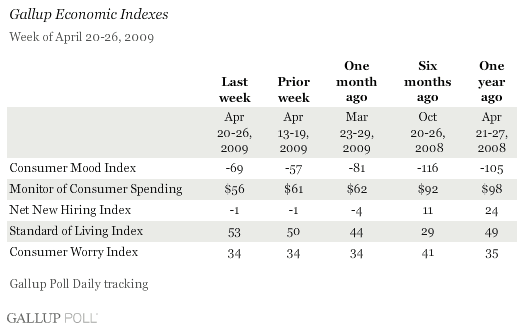
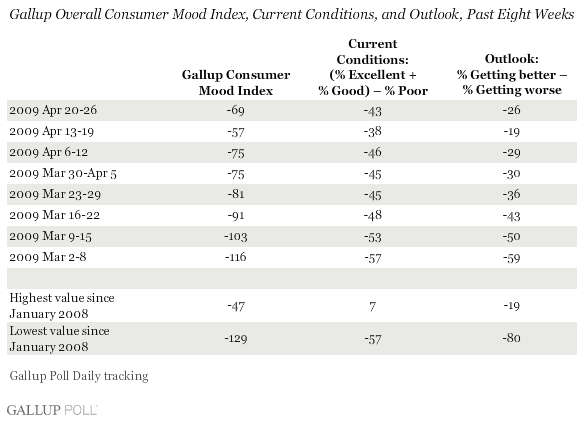
The ÓÅÃÛ´«Ã½Consumer Mood Index worsened to -69 last week, representing a pullback from the -57 for the week ending April 19, but still better than the -75 of the prior two weeks. The Index has improved from -81 just a month ago and from -105 a year ago. While Gallup's data suggest that consumer confidence has improved for the month of April (compared to March) as a whole so far, the recent pullback may suggest a leveling out in the current consumer mood.
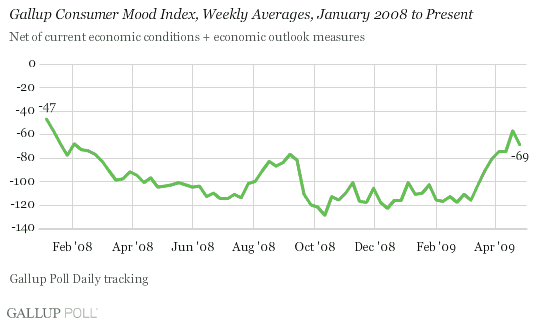
The Consumer Mood Index is based on Americans' answers to two questions -- one asking about current economic conditions in the country and the other about the direction of the economy. Consumers' negativity has diminished significantly on both dimensions compared with early March; however, this has been most pronounced with respect to the economy's direction.
Consumer perceptions that the economy is getting worse rather than better moderated from a net -59 in early March to a net -26 this past week. Consumer perceptions of current economic conditions remain much more negative than positive, with only 9% calling them "excellent" or "good" versus 52% calling them "poor," resulting in a net current conditions score of -43. This is essentially in the same ballpark as the -38 of the previous week and readings in the mid-40s the three weeks before that.
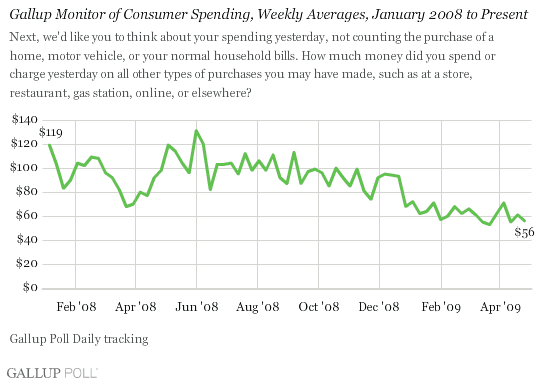
(Unlimited maximum possible value; minimum possible value of $0)
Americans last week reported spending an average of $56 per day in stores, restaurants, gas stations, and online. This is down from the $61 of the previous week and essentially the same as the $55 in average daily spending of the week ending April 12. Spending for the week was down 43% from the $98 daily average of the same week a year ago. Adjusting for seasonal effects by using year-ago comparables suggests consumer spending has yet to respond to all of the stimulative efforts of the Federal Reserve and the Treasury. (Gallup's spending data are based on Americans' self-reports of the total amount of money they spent the prior day on purchases other than a home, a motor vehicle, or their normal monthly bills.)
(Maximum possible value of 100; minimum possible value of -100)
Providing a potentially positive note, employees' reports on hiring and firing patterns at their own workplaces have maintained the major improvement of last week. The ÓÅÃÛ´«Ã½Net New Hiring Index for the week ending April 26 was -1, the same reading as that for the week ending April 19, and up from -11 the previous week (which remains the worst reading since tracking began in January 2008).
From a longer-term perspective, Net New Hiring was in positive territory for most of 2008, descending below zero for the first time in mid-December. It has been in negative territory throughout 2009 thus far.
The ÓÅÃÛ´«Ã½Net New Hiring Index score of -1 for last week is based on the finding that 25% of full- and part-time workers said their employers were hiring people and expanding the number of employees in their workforces, while 26% reported their companies were letting people go and shrinking the size of their workforces. These new data provide some hope that the rate of deterioration in the jobs market is at least stabilizing -- if not improving.
(Maximum possible value of 200; minimum possible value of -200)
The ÓÅÃÛ´«Ã½Standard of Living Index is at 53 for the past week, up from 50 the previous week but still below the 57 of the week ending April 12. Still, the Index is higher than it was a month ago (44), and better than the 49 of a year ago.
The Standard of Living Index is based on two questions -- one asking about respondents' satisfaction with their current standard of living and the other about the perceived direction of their standard of living. This past week, more consumers said their standard of living is getting better (42%) than said it is getting worse (37%). At the same time, 74% of consumers said they were satisfied with their standard of living and 26% were dissatisfied, very similar to prior weeks' results.
(Maximum possible value of 100; minimum possible value of 0)
The ÓÅÃÛ´«Ã½Consumer Worry Index is at 34 for the week ending April 26 -- essentially the same as the readings for the previous four weeks and for the same week a year ago.
Commentary
The Conference Board's consumer confidence report for April is likely to show an increase Tuesday morning, as the consensus among economists suggests. This would be consistent with the substantial improvement in consumer perceptions that Gallup's Consumer Mood Index has reflected throughout the month. However, Gallup's detailed daily and weekly tracking shows that despite this month-to-month improvement, consumers' mood pulled back a little this past week. It remains to be seen whether this is a short-term change or the beginning of a longer-term shift to the negative.
More worrisome than this slight deterioration in consumer mood of the past week, however, is the continued weakness in consumer spending. Consumers have yet to feel comfortable enough with their income and employment situations to return to their day-to-day spending levels of a year ago. And, Gallup's daily spending measure is likely to show a positive trend long before consumers become willing to begin actively purchasing big-ticket items like cars and trucks once again.
Still, the sharp improvement in job-market perceptions of the week ending April 19 was maintained last week. These perceptions -- like the jobless claims data they tend to project -- may suggest at least a stabilizing of the rate of deterioration in the jobs market. While a few more weeks are needed to establish that conditions have indeed stabilized, a real improvement in the jobs outlook may be exactly what is needed for consumers to .
Until the decline in consumer spending comes to a halt, however, no one should assume that the economic downturn has leveled off -- let alone that a recovery has begun. And while it may be premature to project the potential economic impact of the new flu outbreak on the global economy, this is the last thing the U.S. economy needs right now.
Survey Methods
For ÓÅÃÛ´«Ã½Poll Daily tracking, ÓÅÃÛ´«Ã½interviews approximately 1,000 national adults, aged 18 and older, each day. Gallup's consumer series includes the ÓÅÃÛ´«Ã½Consumer Mood Index (evaluating public perceptions about the U.S. economy), the ÓÅÃÛ´«Ã½Monitor of Consumer Spending (a measure of how much money Americans are spending each day on mainly retail purchases), the ÓÅÃÛ´«Ã½Net New Hiring Index (a measure of employee perceptions of hiring conditions where they work), the ÓÅÃÛ´«Ã½Standard of Living Index (evaluating the public's perceptions about its own standard of living), and the ÓÅÃÛ´«Ã½Consumer Worry Index (a measure of the degree to which Americans are worried about their finances).
The Standard of Living Index is based on questions asked of all respondents; the ÓÅÃÛ´«Ã½Consumer Mood Index, the ÓÅÃÛ´«Ã½Monitor of Consumer Spending, and the ÓÅÃÛ´«Ã½Consumer Worry Index are based on random half-samples of approximately 500 national adults, aged 18 and older, each day. The ÓÅÃÛ´«Ã½Net New Hiring Index is based on a sample of approximately 250 current full- and part-time employees each day.
The sample sizes and associated margins of error for weekly results for the week of April 20-26 are:
Interviews are conducted with respondents on land-line telephones (for respondents with a land-line telephone) and cellular phones (for respondents who are cell-phone only).
In addition to sampling error, question wording and practical difficulties in conducting surveys can introduce error or bias into the findings of public opinion polls.
