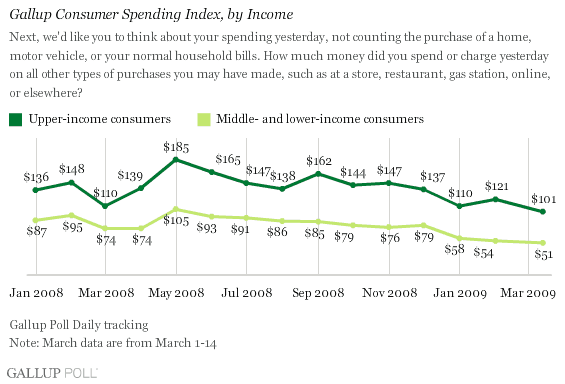
PRINCETON, NJ -- Americans' self-reported spending in stores, restaurants, gas stations, and online averaged $57 per day during the first 14 days of March -- down from $64 during both January and February.

The March 1-14 average is down 31% from the $83 of the same 14-day period a year ago. During March 12-14, consumer spending fell further to $51 -- up from $45 for the prior three days, which was the low for any three-day period since began in January 2008.
Upper-Income Spending Declining
While February's retail sales were down slightly less than expected, Gallup's self-reported consumer spending measure finds Americans spending less in March than in February. Not only are lower- and middle-income consumers continuing to pull back on their spending, but upper-income Americans are doing so as well.

Pullback in Consumer Spending Continuing
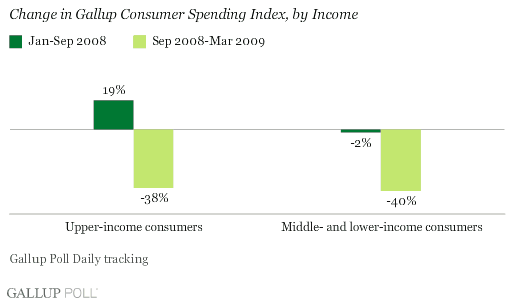
Gallup's self-reported consumer spending measure tends to corroborate the impression that there was a dramatic pullback in Americans' spending starting in September of last year -- particularly among upper-income consumers. Spending by consumers earning $90,000 or more a year rose from $136 per day in January 2008 to $162 in September 2008 -- an increase of 19%. In sharp contrast, spending by lower- and middle-income consumers was essentially unchanged, going from $87 in January to $85 in September. Since September 2008, upper-income spending has fallen by 38% to an average of $101 per day during the first half of March 2009, while consumer spending among the rest of Americans has fallen by 40% to $51.

Commentary
Last week, the stock market rallied not only in response to some good news concerning the nation's banks but also as economic observers interpreted February's less-than-expected decline in retail sales as a sign that the fall in consumer spending may be bottoming out. For example, Lawrence H. Summers, director of the National Economic Council, noted on Friday that "consumer spending in the U.S. … appears … to have stabilized." However, Gallup's early March readings on self-reported consumer spending suggests it may be a little too early to celebrate an end to the decline in consumer spending. Importantly, upper-income consumers, as well as those with lower and middle incomes, continue to pull back on their spending.
The sharp drop in upper-income spending since the financial crisis took hold in mid-September has significant implications for the U.S. economy. Upper-income consumer spending has a disproportionate impact on overall retail sales because those with higher incomes spend proportionately more than their lower- and middle-income counterparts. These upper-income consumers are also more likely to make major purchases -- some of which would not be included in Gallup's consumer spending measure, such as the purchase of homes or motor vehicles.
In this regard, the uptick in upper-income consumer spending from an average of $110 in January of this year to $121 in February was a hopeful sign that may have been reflected in February retail sales. On the other hand, the decline in upper-income spending to $101 during the first 14 days of March is just the reverse -- a potential sign that retail sales could deteriorate even further this month.
Gallup's consumer spending measure for Americans of all income levels also declined in March 2008 as gas prices increased, so there could be some seasonal effects in addition to the gas-price effects in these self-reported spending trends. Consumer spending was down 34% from a year ago in January and down 40% in February compared to the 31% decline of the first half of March. Further, and somewhat ironically, upper-income spending is likely to be influenced by a stock market "wealth effect." So, the recent surge in the stock market could help improve upper-income spending in the days ahead. And, further down the road in April, the fiscal stimulus will begin reducing employee withholding, which should help middle- and lower-income spending on the margin.
In sum, Gallup's spending data suggests it is probably too early to suggest that consumer spending has "stabilized." However, ���۴�ýPoll Daily tracking will show whether that is indeed the case during the weeks and months ahead.
Survey Methods
Gallup's Consumer Spending Index is based on aggregated interviews with a nationally representative sample of more than 12,000 adults aged 18 or older each month. For results based on these samples, the maximum margin of sampling error is ±1 percentage points.
Interviews are conducted with respondents on land-line telephones (for respondents with a land-line telephone) and cellular phones (for respondents who are cell-phone only).
In addition to sampling error, question wording and practical difficulties in conducting surveys can introduce error or bias into the findings of public opinion polls.
