PRINCETON, NJ -- With President Obama warning about dire consequences if Congress did not pass a fiscal stimulus bill and with January's dismal jobs report marking the highest unemployment rate in 16 years, there has been a quick end to the bounce in consumer mood that occurred around January's presidential inauguration.
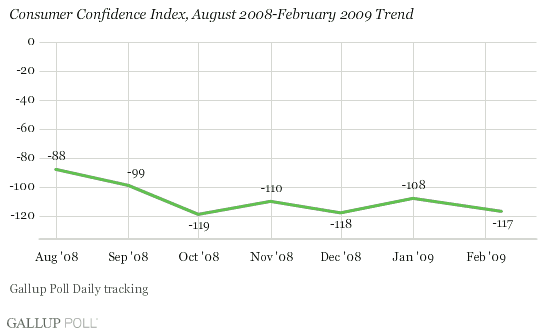
Gallup's Consumer Confidence Index Worsens
Consumer perceptions of the economy deteriorated during the first half of 2008, with Gallup's Consumer Confidence Index becoming increasingly negative as gas prices rose and ultimately surpassed $4 a gallon. Consumers began to feel somewhat better in the summer as gas prices moderated, but consumers turned even more negative as the financial crisis erupted during the fall. The presidential election and the subsequent inauguration both seemed to help improve the consumer mood somewhat, as did the inauguration. However, in both cases, the improvement in consumer confidence was short-lived.
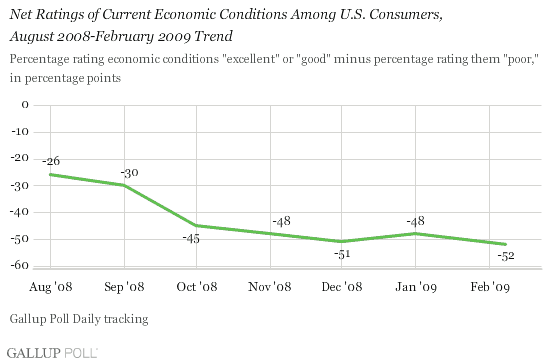
The ���۴�ýConsumer Confidence Index combines consumers' ratings of the current economy (the percentage rating the economy "excellent" or "good" minus the percentage rating it "poor") with their expectations for the economy's future direction (the percentage saying economic conditions are "getting better" minus the percentage saying they are "getting worse"). Consumers' ratings of the current economy were -48 points in January -- an improvement of three points from December's average of -51. However, during the first week of February, this improvement disappeared, as the average fell to -52.
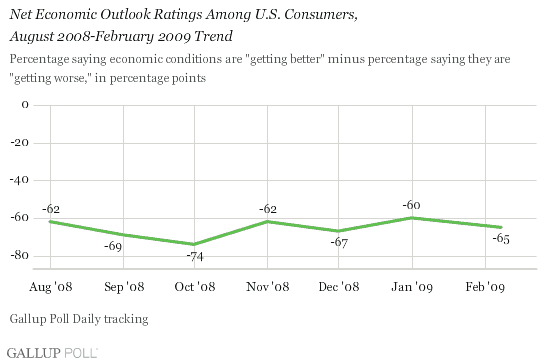
Net consumer expectations for the future direction of the U.S. economy also improved in January, increasing seven points from December's -67 average. Consumer expectations gave up most of this gain in early February, declining to -65.
Thus, Gallup's Consumer Confidence Index for early February is -117, combining the -52 score for current economic conditions and the -65 for expectations.
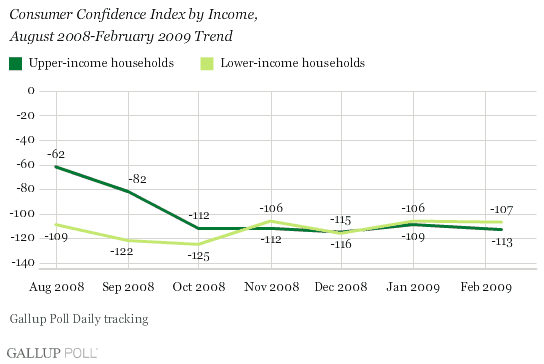
Upper-, Lower-Income Households Equally Pessimistic Since November
Prior to the financial crisis, upper-income Americans (with an Index score of -62 in August 2008) were much less negative than lower-income households (-109). But by November 2008, that wide gap in consumer perceptions had disappeared, as upper-income households (-112) had become just as negative as, if not slightly more so than, lower-income households (-106). This trend has continued since then, and in early February, the Index among upper-income households was -113 and it was -107 among lower-income households.
Commentary
New ���۴�ýpolling suggests President Obama may be making progress in selling the unprecedented fiscal stimulus plan, with , which he may sign this week after the House and Senate reconciled their versions of the bill on Wednesday.
While efforts to sell the plan may have the unintended consequence of worsening consumer confidence in the immediate term, as reflected by the early February ���۴�ýConsumer Confidence Index, final passage of the stimulus bill may make at least some Americans a little more optimistic.
However, it may be that the Treasury's financial rescue program will be even more important as far as improving consumer and investor confidence is concerned. It is essential that the U.S. financial system return to something approximating normal functioning as soon as possible. And, this could end up being extremely difficult. It may be that the reason Treasury Secretary Timothy Geithner has yet to produce the details of the new financial rescue program has to do with the need to get the fiscal stimulus bill passed by the Congress before those details are revealed.
Survey Methods
���۴�ýhas been interviewing no fewer than 1,000 U.S. adults nationwide each day during 2008 and 2009. The economic questions analyzed in this report are asked of a random half-sample of respondents each day. The results reported here are based on combined data of more than 8,000 interviews in August, September, October, November, and December 2008, and in January 2009. For results based on these samples, the maximum margin of sampling error is ±1 percentage point.
The questions for Feb. 2-8, 2009, are based on combined data of 3,404 interviews. For results based on these samples, the maximum margin of sampling error is ±3 percentage points.
Interviews are conducted with respondents on land-line telephones (for respondents with a land-line telephone) and cellular phones (for respondents who are cell-phone only).
In addition to sampling error, question wording and practical difficulties in conducting surveys can introduce error or bias into the findings of public opinion polls.
