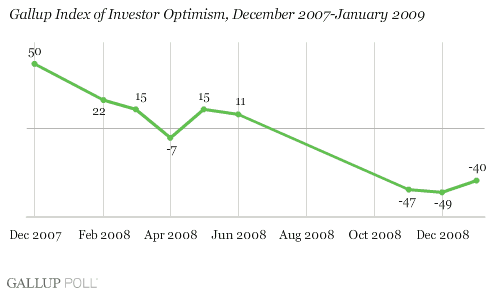
PRINCETON, NJ -- American investors remain highly pessimistic about the overall U.S. investment climate in January, with the ÆéûÜǨû§Index of Investor Optimism now at -40. But , investors are slightly less pessimistic this month than they were in December (-49).

Slight Improvement Along Both Dimensions
Gallup's Index of Investor Optimism -- based on a survey of those having $10,000 or more of investable assets -- is designed to reflect American investors' views of the investment climate. Econometric analysis has shown that Gallup's Index is a somewhat better predictor of the future direction of the U.S. economy than traditional consumer confidence measures. The Index peaked in January 2000 at 178 -- prior to the bursting of the dot-com bubble. Before last year, the low for the Index was 5 in March 2003, reflecting investor concerns at the outset of the Iraq war. The new low of -49, as noted, was registered in December 2008.
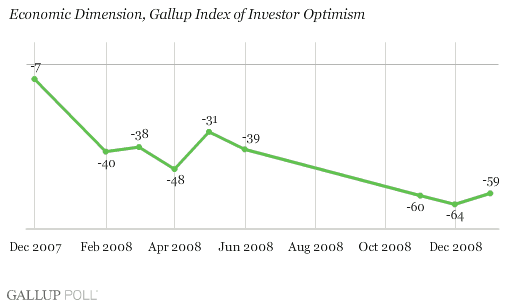
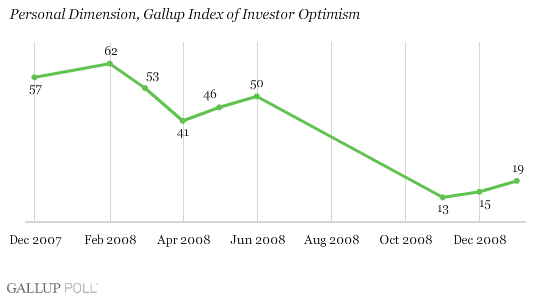
January's results show investors to be slightly less pessimistic than they were late last year along both dimensions of the Index. Investors remain highly negative about the economic outlook for the next 12 months, with the Economic Dimension of the Index at -59 -- although this is slightly better than December's -64. At the same time, investors remain somewhat positive about their personal portfolios, with the Personal Dimension at +19 -- up from +15 in December.


Slight Obama Bounce in Investor Perceptions
The big money on Wall Street seems less than enthusiastic about the change in power in Washington, D.C., and the new Obama economic team, with the Dow down about 8% so far this year. In sharp contrast, Gallup's Index of Investor Optimism suggests that U.S. investors as a group are a little less pessimistic this January than they were during the last couple of months of 2008. In this regard, investors seem to share the modest bounce in confidence among all Americans reflected by Gallup's other attitudinal economic measures.
Given the country's dreadful economic performance during the last year of the Bush economic team, it is not hard to see how a change in teams -- or, for that matter, the historic inauguration of last week -- could inspire at least a marginal improvement in investor and consumer confidence. In fact, it seems likely that the Conference Board will report a slight improvement in its Consumer Confidence Index on Tuesday morning.
Still, the fact that both investors and consumers remain highly pessimistic about the future course of the U.S. economy illustrates the major confidence problem that exists at this time. Consumers are worried about the overall economy, fearful about their jobs, and pulling back from spending, particularly as far as big-ticket items are concerned. The resulting downward economic spiral characterized by increasing unemployment and increasing fear has just begun to unfold.
The Federal Reserve is making unprecedented efforts to get credit flowing but the credit crunch persists. Congress is debating an unprecedented fiscal stimulus plan, but old-time politics seems to dominate this legislative effort, with Democrats arguing that all spending is stimulative and Republicans countering that only tax cuts will work.
The real economic challenge facing the new Obama administration is not just to pass a new fiscal stimulus plan, but to adopt a plan that will begin restoring investor and consumer confidence in the U.S. economy in the months ahead. And this requires something of a consensus among the nation's business and political leaders.
It seems like this should be possible when the legislation involved is expected to total somewhere between $800 billion and $1 trillion. Still, political calculus sometimes conflicts with both good economic policy and economic consensus building. Regardless, Gallup's daily economic measures will let Americans know quickly whether the president's and Congress' efforts are succeeding in building investor and consumer confidence.
Survey Methods
ÆéûÜǨû§Poll Daily interviewing includes no fewer than 1,000 U.S. adults nationwide each day during 2008. The Index of Investor Optimism results are based on questions asked of 1,000 or more investors over a three-day period each month Jan. 16-18, 2009, and Dec. 16-18, Nov. 24-26, June 3-6, April 25-28, March 28-31, and Feb. 28-March 2, 2008. For results based on these samples, the maximum margin of sampling error is ôÝ3 percentage point.
Results for May are based on the ÆéûÜǨû§Panel study and are based on telephone interviews with 576 national adults, aged 18 and older, conducted May 19-21, 2008. ÆéûÜǨû§Panel members are recruited through random selection methods. The panel is weighted so that it is demographically representative of the U.S. adult population. For results based on this sample, one can say with 95% confidence that the maximum margin of sampling error is ôÝ5 percentage points.
For investor results prior to 2008, telephone interviews were conducted with at least 800 investors, aged 18 and older, and having at least $10,000 of investable assets. For the total sample of investors in these surveys, one can say with 95% confidence that the maximum margin of sampling error is ôÝ 4 percentage points.
In addition to sampling error, question wording and practical difficulties in conducting surveys can introduce error or bias into the findings of public opinion polls.
