GALLUP NEWS SERVICE
PRINCETON, NJ -- Gallup's annual update on the American public's image of countries around the world shows that France and Germany are now seen in a somewhat better light than they were last year, when both were heavily criticized for refusing to take part in the U.S.-led military action against Iraq. Despite this improvement, however, only about half of Americans today have a favorable image of France, far below the more positive ratings the country received in the years before the Iraq war. Of interest is that Republicans have a much more negative image of France than do independents and Democrats -- a partisan differentiation that was not the case in the pre-Iraq war days. About one in five Americans now have a favorable image of Iraq, which is more positive than it has been at any other point in ”≈√€¥´√ΩPoll history. Australia, Great Britain, and Canada remain the three countries with the most positive images, while North Korea has the most negative image of any of the 22 countries measured this year.
From Australia to North Korea
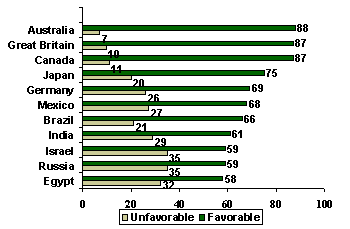
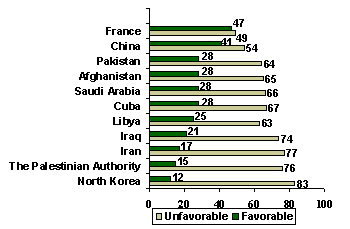
Gallup's basic question asks Americans if their "overall opinion of [country] is very favorable, mostly favorable, mostly unfavorable, or very unfavorable." ”≈√€¥´√Ωhas been asking this question about some countries for 20 years or more; for others it has been asked only once or twice more recently. The Feb. 9-12 ”≈√€¥´√ΩPoll included 22 countries, with the following basic results:
| Opinion of Foreign Countries |
 |
| Feb. 9-12, 2004 |
| Opinion of Foreign Countries |
 |
| Feb. 9-12, 2004 |
There is a tremendous range of attitudes toward these countries. At the top of the list (based on the percentage of Americans who give each country a favorable rating) are three English-speaking nations: Australia, Great Britain, and Canada, each of which is viewed favorably by 87% to 88% of Americans. Next comes Japan, with a 75% favorable rating, followed by four nations with favorable ratings in the 60%-or-better range: Germany, Mexico, Brazil, and India.
Only one country, North Korea, has unfavorable ratings in the 80%-plus range (83% unfavorable), while three countries are viewed unfavorably by 70% to 80% of the American public (Iran, the Palestinian Authority, and Iraq). Another five are seen unfavorably by 60% to 70% (Cuba, Saudi Arabia, Afghanistan, Pakistan, and Libya).
Trends
These basic ratings of the images of the countries as they stand today conceal some fascinating changes that have taken place over time.
France
France routinely received favorable ratings of 70% or more from the American public throughout the 1990s and early 2000s, making it one of the countries about which Americans had the most positive opinions.
Then, the government of France and its leader, Jacques Chirac, took a strongly anti-American stance in its position on the use of military force in Iraq at the end of 2002 and beginning of 2003. American sentiment toward the country in some quarters became so negative that there were half-serious efforts to ban the use of the names french fries and french toast. The favorable image of France nose-dived from 79% in February 2002 to 59% in February 2003, and then all the way down to 34% in March of last year, just as the war with Iraq was getting underway.
| Opinion of France |
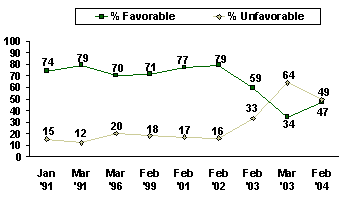 |
There has been a rebound of sorts this year. Forty-seven percent of Americans now have a favorable opinion of France, still slightly below the 49% who have an unfavorable opinion, and also well below the high ratings of pre-2003. In other words, there seems to be a growing rapprochement with France, but there is still a good deal of ill will to make up.
An analysis of perceptions of France by partisan identification shows a fascinating, although not unexpected, pattern. Republicans today have a much more negative image of France than do independents and Democrats. That stands in contrast to the pre-Iraq war days, when there was no significant difference in opinions about France by party:
|
Opinion of France by Partisan
Identification |
||||
|
Feb 4-6, 2002 |
Feb 9-12, 2004 |
|||
|
Favorable |
Unfavorable |
Favorable |
Unfavorable |
|
|
Republicans |
81% |
15 |
33 |
64 |
|
Independents |
78% |
16 |
50 |
46 |
|
Democrats |
78% |
16 |
58 |
37 |
Germany
Germany's image in the eyes of the American public, like France's, suffered in the wake of last year's lead up to the war in Iraq (like France, Germany and its leader, Chancellor Gerhard Schroeder, refused to participate in the U.S.-led military efforts), but at all times it remained more positive than the image of France did. Similarly, Germany's image has recovered faster than has France's.
| Opinion of Germany |
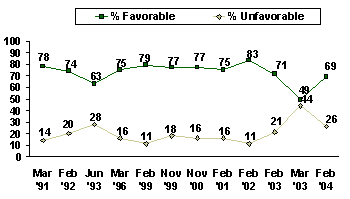 |
Americans' ratings of Germany went from 83% favorable in February 2002 to 71% in February 2003, and then down to 49% in March of last year (still 15 points more positive than the image of France). This year, Germany is back up to a 69% favorable rating, almost as high as it had been in pre-2003 years, and also significantly more positive than France's current rating.
Iraq
Not surprisingly, Iraq has routinely been one of the most negatively evaluated countries that ”≈√€¥´√Ωhas tested with the public. In survey after survey over the last decade, 80% to 90% of the American public gave Iraq an unfavorable rating, capped by a 93% unfavorable rating last March, just as the U.S. military action in that country started.
Now, almost a year after the fall of Saddam Hussein, the American public's attitudes have softened a bit. The percentage with an unfavorable attitude toward Iraq has dropped to 74%, while the percentage with a favorable impression has gone from 5% last year to 21% this year. This, of course, still leaves Iraq near the bottom of the list of all countries rated in this year's survey, but it is no longer dead last, as it was last year.
| Opinion of Iraq |
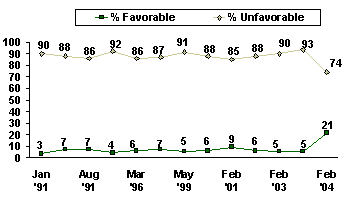 |
(”≈√€¥´√Ωhas not tracked attitudes toward Iraq on a month-by-month basis. It is possible that Americans' feelings actually were more positive immediately after the military action began, and that they have become more negative in more recent months as insurgent activities have resulted in continuing U.S. military casualties.)
Libya
There has been only a slight change in the opinion of the American public about Libya between last year and this year, despite the fact that Libyan leader Colonel Muammar Gaddafi has agreed to abandon his country's program of developing weapons of mass destruction.
| Opinion of Libya |
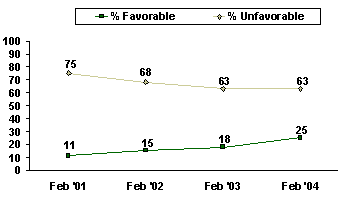 |
Twenty-five percent of Americans now have a favorable opinion of Libya, while 63% have an unfavorable opinion. That's slightly more positive than last year, when 18% had a favorable opinion (the same 63% had an unfavorable opinion last year, the difference being that there were more "don't knows" last year than this year).
Saudi Arabia
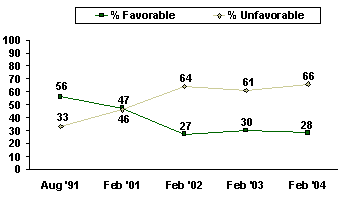
The image of Saudi Arabia has changed significantly over the last 13 years. In August 1991, a few months after the end of the Persian Gulf War during which Saudi Arabia had allowed the United States to use its country as a staging base for the invasion of Kuwait and Iraq, 56% of Americans said they had a favorable opinion of Saudi Arabia, compared with 33% who had an unfavorable opinion.
By February 2001, the image of Saudi Arabia had become somewhat more negative, with a 47% favorable and 46% unfavorable rating. Then, in February 2002, after the Sept. 11 attacks in New York and Washington, D.C., and the subsequent identification in press accounts of several of the terrorists as Saudis, the image of the country became much more negative -- 27% favorable and 64% unfavorable. Saudi Arabia's image has stayed roughly the same in the years since, and this year is at 28% favorable and 66% unfavorable.
| Opinion of Saudi Arabia |
 |
Survey Methods
These results are based on telephone interviews with a randomly selected national sample of 1,002 adults, aged 18 and older, conducted Feb. 9-12, 2004. For results based on this sample, one can say with 95% confidence that the maximum error attributable to sampling and other random effects is ±3 percentage points. In addition to sampling error, question wording and practical difficulties in conducting surveys can introduce error or bias into the findings of public opinion polls.
23. Next, I'd like your overall opinion of some foreign countries. First, is your overall opinion of [RANDOM ORDER]very favorable, mostly favorable, mostly unfavorable, or very unfavorable? How about -- [INSERT NEXT ITEM]?
Favorability of Nations Trend
- Afghanistan
|
Very favor- |
Mostly favor- |
Mostly unfavor- |
Very unfavor- |
No |
Total favor- |
Total unfavor-able |
|
|
% |
% |
% |
% |
% |
% |
% |
|
|
2004 Feb 9-12 |
4 |
24 |
39 |
26 |
7 |
28 |
65 |
|
2003 Feb 3-6 |
2 |
23 |
40 |
26 |
9 |
25 |
66 |
|
2002 Feb 1-4 |
4 |
22 |
34 |
34 |
6 |
26 |
68 |
B. Australia
|
Very favor- |
Mostly favor- |
Mostly unfavor- |
Very unfavor- |
No |
Total favor- |
Total unfavor-able |
|
|
2004 Feb 9-12 |
39% |
49 |
5 |
2 |
5 |
88 |
7 |
|
2001 Feb 1-4 |
43% |
42 |
4 |
4 |
7 |
85 |
8 |
C. Brazil
|
Very favor- |
Mostly favor- |
Mostly unfavor- |
Very unfavor- |
No |
Total favor- |
Total unfavor-able |
|
|
% |
% |
% |
% |
% |
% |
% |
|
|
2004 Feb 9-12 |
11 |
55 |
18 |
3 |
13 |
66 |
21 |
|
2001 Feb 1-4 |
13 |
56 |
12 |
5 |
14 |
69 |
17 |
|
1999 Feb 8-9 |
10 |
49 |
13 |
4 |
24 |
59 |
17 |
D. Canada
|
Very favor- |
Mostly favor- |
Mostly unfavor- |
Very unfavor- |
No |
Total favor- |
Total unfavor-able |
||
|
% |
% |
% |
% |
% |
% |
% |
||
|
2004 Feb 9-12 |
36 |
51 |
7 |
4 |
2 |
87 |
11 |
|
|
2003 Feb 3-6 |
43 |
46 |
6 |
1 |
4 |
89 |
7 |
|
|
2002 Feb 4-6 |
49 |
43 |
4 |
1 |
3 |
92 |
5 |
|
|
2001 Feb 1-4 ^ |
51 |
39 |
4 |
3 |
3 |
90 |
7 |
|
|
1999 Feb 8-9 |
43 |
47 |
2 |
1 |
7 |
90 |
3 |
|
|
1996 Mar 8-10 |
47 |
42 |
5 |
* |
6 |
89 |
5 |
|
|
1992 Feb 6-9 |
40 |
51 |
4 |
1 |
4 |
91 |
5 |
|
|
1991 Mar 14-17 |
48 |
43 |
2 |
1 |
6 |
91 |
3 |
|
|
1989 Aug 10-13 |
49 |
44 |
1 |
1 |
5 |
93 |
2 |
|
|
1989 Feb 28-Mar 2 |
45 |
47 |
2 |
1 |
2 |
92 |
3 |
|
|
1987 Nov 6-Dec 4 |
51 |
42 |
2 |
1 |
4 |
93 |
3 |
|
|
^ |
Asked of half sample |
|||||||
E. China
|
Very favor- |
Mostly favor- |
Mostly unfavor- |
Very unfavor- |
No |
Total favor- |
Total unfavor-able |
||
|
% |
% |
% |
% |
% |
% |
% |
||
|
2004 Feb 9-12 |
6 |
35 |
38 |
16 |
5 |
41 |
54 |
|
|
2003 Feb 3-6 |
6 |
39 |
34 |
12 |
9 |
45 |
46 |
|
|
2002 Feb 4-6 |
6 |
38 |
37 |
12 |
7 |
44 |
49 |
|
|
2001 Feb 1-4 ^ |
5 |
40 |
31 |
17 |
7 |
45 |
48 |
|
|
2000 Nov 13-15 |
5 |
31 |
39 |
18 |
7 |
36 |
57 |
|
|
2000 Mar 17-19 |
6 |
29 |
40 |
16 |
9 |
35 |
56 |
|
|
2000 Jan 25-26 |
4 |
29 |
33 |
18 |
16 |
33 |
51 |
|
|
1999 May 7-9 |
5 |
33 |
38 |
18 |
6 |
38 |
56 |
|
|
1999 Mar 12-14 ^ |
2 |
32 |
39 |
20 |
7 |
34 |
59 |
|
|
1999 Feb 8-9 |
8 |
31 |
34 |
16 |
11 |
39 |
50 |
|
|
1998 Jul 7-8 |
6 |
38 |
36 |
11 |
9 |
44 |
47 |
|
|
1998 Jun 22-23 |
5 |
34 |
42 |
9 |
10 |
39 |
47 |
|
|
1997 Jun 26-29 |
5 |
28 |
36 |
14 |
17 |
33 |
50 |
|
|
1996 Mar 8-10 |
6 |
33 |
35 |
16 |
10 |
39 |
51 |
|
|
1994 Feb 26-28 |
4 |
36 |
38 |
15 |
7 |
40 |
53 |
|
|
1991 Mar 14-17 |
5 |
30 |
35 |
18 |
12 |
35 |
53 |
|
|
1989 Aug 10-13 |
5 |
29 |
32 |
22 |
12 |
34 |
54 |
|
|
1989 Feb 28-Mar 2 |
12 |
60 |
10 |
3 |
15 |
72 |
13 |
|
|
1985 Feb 22-Mar 3 |
5 |
33 |
35 |
16 |
11 |
38 |
51 |
|
|
1979 Sep |
18 |
46 |
18 |
7 |
10 |
64 |
25 |
|
|
^ |
Asked of half sample |
|||||||
F. Cuba
|
Very favor- |
Mostly favor- |
Mostly unfavor- |
Very unfavor- |
No |
Total favor- |
Total unfavor-able |
||
|
% |
% |
% |
% |
% |
% |
% |
||
|
2004 Feb 9-12 |
3 |
25 |
44 |
23 |
5 |
28 |
67 |
|
|
2003 Feb 3-6 |
4 |
24 |
42 |
21 |
9 |
28 |
63 |
|
|
2002 Feb 4-6 |
4 |
27 |
41 |
20 |
8 |
31 |
61 |
|
|
2001 Feb 1-4 ^ |
4 |
23 |
41 |
27 |
5 |
27 |
68 |
|
|
1999 May 7-9 |
4 |
20 |
45 |
24 |
7 |
24 |
69 |
|
|
1999 Mar 19-21 |
4 |
28 |
48 |
13 |
7 |
32 |
61 |
|
|
1996 Mar 8-10 ^ |
2 |
8 |
40 |
41 |
9 |
10 |
81 |
|
|
^ |
Asked of half sample |
|||||||
G. Egypt
|
Very favor- |
Mostly favor- |
Mostly unfavor- |
Very unfavor- |
No |
Total favor- |
Total unfavor- |
||
|
% |
% |
% |
% |
% |
% |
% |
||
|
2004 Feb 9-12 |
7 |
51 |
25 |
7 |
10 |
58 |
32 |
|
|
2003 Feb 3-6 |
6 |
50 |
20 |
5 |
19 |
56 |
25 |
|
|
2002 Feb 4-6 |
7 |
47 |
29 |
5 |
12 |
54 |
34 |
|
|
2001 Feb 1-4 ^ |
11 |
54 |
19 |
4 |
12 |
65 |
23 |
|
|
1996 Mar 8-10 |
10 |
48 |
19 |
5 |
17 |
58 |
24 |
|
|
1991 Aug 8-11 |
9 |
54 |
15 |
5 |
17 |
63 |
20 |
|
|
1991 Mar 14-17 |
11 |
55 |
14 |
3 |
17 |
66 |
17 |
|
|
1991 Jan 30-Feb 2 |
10 |
56 |
12 |
3 |
19 |
66 |
15 |
|
|
^ |
Asked of half sample |
|||||||
H. France
|
Very favor- |
Mostly favor- |
Mostly unfavor- |
Very unfavor- |
No |
Total favor- |
Total unfavor- |
||||||||
|
% |
% |
% |
% |
% |
% |
% |
||||||||
|
2004 Feb 9-12 |
10 |
37 |
31 |
18 |
4 |
47 |
49 |
|||||||
|
2003 Mar 14-15 ^ |
6 |
28 |
25 |
39 |
2 |
34 |
64 |
|||||||
|
2003 Feb 3-6 |
13 |
46 |
23 |
10 |
8 |
59 |
33 |
|||||||
|
2002 Feb 4-6 |
23 |
56 |
13 |
3 |
5 |
79 |
16 |
|||||||
|
2001 Feb 1-4 ^ |
22 |
55 |
12 |
5 |
6 |
77 |
17 |
|||||||
|
1999 Feb 8-9 |
17 |
54 |
14 |
4 |
11 |
71 |
18 |
|||||||
|
1996 Mar 8-10 |
15 |
55 |
16 |
4 |
11 |
70 |
20 |
|||||||
|
1991 Mar 14-17 |
18 |
61 |
9 |
3 |
9 |
79 |
12 |
|||||||
|
1991 Jan 30-Feb 2 |
17 |
57 |
11 |
4 |
11 |
74 |
15 |
|||||||
|
^ |
Asked of half sample |
|||||||||||||
I. Germany
|
Very favor- |
Mostly favor- |
Mostly unfavor- |
Very unfavor- |
No |
Total favor- |
Total unfavor-able |
||
|
% |
% |
% |
% |
% |
% |
% |
||
|
2004 Feb 9-12 |
13 |
56 |
19 |
7 |
5 |
69 |
26 |
|
|
2003 Mar 14-15 ^ |
8 |
41 |
30 |
14 |
7 |
49 |
44 |
|
|
2003 Feb 3-6 |
12 |
59 |
16 |
5 |
8 |
71 |
21 |
|
|
2002 Feb 4-6 |
22 |
61 |
8 |
3 |
6 |
83 |
11 |
|
|
2001 Feb 1-4 ^ |
20 |
55 |
9 |
7 |
9 |
75 |
16 |
|
|
2000 Nov 13-15 |
16 |
61 |
11 |
5 |
7 |
77 |
16 |
|
|
1999 Nov 4-7 |
11 |
66 |
13 |
5 |
5 |
77 |
18 |
|
|
1999 Feb 8-9 |
18 |
61 |
7 |
4 |
10 |
79 |
11 |
|
|
1996 Mar 8-10 |
17 |
58 |
13 |
3 |
9 |
75 |
16 |
|
|
1993 Jun 29-30 |
10 |
53 |
19 |
9 |
9 |
63 |
28 |
|
|
1992 Feb 6-9 |
17 |
57 |
14 |
6 |
6 |
74 |
20 |
|
|
1991 Mar 14-17 |
16 |
62 |
11 |
3 |
8 |
78 |
14 |
|
|
^ |
Asked of half sample |
|||||||
23, continued. Next, I'd like your overall opinion of some foreign countries. First, is your overall opinion of [RANDOM ORDER]very favorable, mostly favorable, mostly unfavorable, or very unfavorable? How about -- [INSERT NEXT ITEM]?
Favorability of Nations Trend (continued)
J. Great Britain
|
Very favor- |
Mostly favor- |
Mostly unfavor- |
Very unfavor- |
No |
Total favor- |
Total unfavor-able |
||
|
% |
% |
% |
% |
% |
% |
% |
||
|
2004 Feb 9-12 |
40 |
47 |
7 |
3 |
3 |
87 |
10 |
|
|
2003 Mar 14-15 ^ |
43 |
43 |
6 |
3 |
5 |
86 |
9 |
|
|
2003 Feb 3-6 |
45 |
44 |
4 |
2 |
5 |
89 |
6 |
|
|
2002 Feb 4-6 |
48 |
42 |
5 |
2 |
3 |
90 |
7 |
|
|
2001 Feb 1-4 ^ |
41 |
44 |
6 |
3 |
6 |
85 |
9 |
|
|
2000 Nov 13-15 |
27 |
55 |
7 |
3 |
8 |
82 |
10 |
|
|
1999 May 7-9 |
37 |
52 |
5 |
3 |
3 |
89 |
8 |
|
|
1999 Feb 8-9 |
34 |
50 |
4 |
3 |
9 |
84 |
7 |
|
|
1996 Mar 8-10 |
30 |
51 |
8 |
2 |
9 |
81 |
10 |
|
|
1991 Mar 14-17 |
49 |
40 |
4 |
1 |
6 |
89 |
5 |
|
|
1991 Jan 30-Feb 2 |
45 |
45 |
3 |
1 |
6 |
90 |
4 |
|
|
1989 Feb 28-Mar 2 |
29 |
57 |
4 |
3 |
7 |
86 |
7 |
|
|
^ |
Asked of half sample |
|||||||
K. India
|
Very favor- |
Mostly favor- |
Mostly unfavor- |
Very unfavor- |
No |
Total favor- |
Total unfavor-able |
||
|
% |
% |
% |
% |
% |
% |
% |
||
|
2004 Feb 9-12 |
8 |
53 |
23 |
6 |
10 |
61 |
29 |
|
|
2002 Feb 4-6 |
7 |
49 |
25 |
8 |
11 |
56 |
33 |
|
|
2001 Feb 1-4 ^ |
8 |
50 |
24 |
6 |
12 |
58 |
30 |
|
|
2000 Mar 17-19 |
7 |
40 |
30 |
8 |
15 |
47 |
38 |
|
|
^ |
Asked of half sample |
|||||||
L. Iran
|
Very favor- |
Mostly favor- |
Mostly unfavor- |
Very unfavor- |
No |
Total favor- |
Total unfavor-able |
||
|
% |
% |
% |
% |
% |
% |
% |
||
|
2004 Feb 9-12 |
3 |
14 |
46 |
31 |
6 |
17 |
77 |
|
|
2003 Mar 14-15 ^ |
2 |
11 |
48 |
31 |
8 |
13 |
79 |
|
|
2003 Feb 3-6 |
2 |
11 |
48 |
29 |
10 |
13 |
77 |
|
|
2002 Feb 4-6 |
2 |
9 |
46 |
38 |
5 |
11 |
84 |
|
|
2001 Feb 1-4 ^ |
2 |
10 |
45 |
38 |
5 |
12 |
83 |
|
|
1996 Mar 8-10 |
1 |
5 |
38 |
46 |
10 |
6 |
84 |
|
|
1991 Aug 8-11 |
1 |
12 |
44 |
35 |
9 |
13 |
79 |
|
|
1991 Mar 14-17 |
3 |
11 |
41 |
35 |
10 |
14 |
76 |
|
|
1991 Jan 30-Feb 2 |
2 |
11 |
39 |
40 |
8 |
13 |
79 |
|
|
1989 Aug 10-13 |
1 |
4 |
27 |
62 |
6 |
5 |
89 |
|
|
1989 Feb 28-Mar 2 |
1 |
4 |
27 |
62 |
6 |
5 |
89 |
|
|
^ |
Asked of half sample |
|||||||
M. Iraq
|
Very favor- |
Mostly favor- |
Mostly unfavor- |
Very unfavor- |
No |
Total favor- |
Total unfavor-able |
||
|
% |
% |
% |
% |
% |
% |
% |
||
|
2004 Feb 9-12 |
4 |
17 |
39 |
35 |
5 |
21 |
74 |
|
|
2003 Mar 14-15 ^ |
3 |
2 |
25 |
68 |
2 |
5 |
93 |
|
|
2003 Feb 3-6 |
1 |
4 |
33 |
57 |
5 |
5 |
90 |
|
|
2002 Feb 4-6 |
2 |
4 |
39 |
49 |
6 |
6 |
88 |
|
|
2001 Feb 1-4 ^ |
2 |
7 |
34 |
51 |
6 |
9 |
85 |
|
|
2000 Nov 13-15 |
2 |
4 |
35 |
53 |
6 |
6 |
88 |
|
|
1999 May 7-9 |
1 |
4 |
38 |
53 |
4 |
5 |
91 |
|
|
1999 Feb 8-9 |
2 |
5 |
27 |
60 |
6 |
7 |
87 |
|
|
1996 Mar 8-10 |
1 |
5 |
34 |
52 |
8 |
6 |
86 |
|
|
1992 Feb 6-9 |
1 |
3 |
30 |
62 |
4 |
4 |
92 |
|
|
1991 Aug 8-11 |
1 |
6 |
32 |
54 |
7 |
7 |
86 |
|
|
1991 Mar 14-17 |
2 |
5 |
26 |
62 |
5 |
7 |
88 |
|
|
1991 Jan 30-Feb 2 |
* |
3 |
17 |
73 |
7 |
3 |
90 |
|
|
^ |
Asked of half sample |
|||||||
N. Israel
|
Very favor- |
Mostly favor- |
Mostly unfavor- |
Very unfavor- |
No |
Total favor- |
Total unfavor-able |
||
|
% |
% |
% |
% |
% |
% |
% |
||
|
2004 Feb 9-12 |
14 |
45 |
25 |
10 |
6 |
59 |
35 |
|
|
2003 Feb 3-6 |
22 |
42 |
23 |
6 |
7 |
64 |
29 |
|
|
2002 Feb 4-6 |
16 |
42 |
25 |
10 |
7 |
58 |
35 |
|
|
2001 Feb 1-4 ^ |
18 |
45 |
20 |
12 |
5 |
63 |
32 |
|
|
2000 Mar 17-19 |
16 |
46 |
20 |
8 |
10 |
62 |
28 |
|
|
2000 Jan 25-26 |
11 |
43 |
21 |
7 |
18 |
54 |
28 |
|
|
1999 May 7-9 |
15 |
53 |
19 |
6 |
7 |
68 |
25 |
|
|
1999 Feb 8-9 |
18 |
48 |
16 |
7 |
11 |
66 |
23 |
|
|
1996 Mar 8-10 |
17 |
45 |
18 |
11 |
9 |
62 |
29 |
|
|
1992 Feb 6-9 |
12 |
36 |
27 |
16 |
9 |
48 |
43 |
|
|
1991 Nov 21-14 |
11 |
36 |
26 |
11 |
16 |
47 |
37 |
|
|
1991 Sep 26-29 |
11 |
45 |
25 |
9 |
10 |
56 |
34 |
|
|
1991 Aug 8-11 |
15 |
47 |
19 |
6 |
12 |
62 |
25 |
|
|
1991 Mar 14-17 |
20 |
49 |
16 |
7 |
8 |
69 |
23 |
|
|
1991 Jan 30-Feb 2 |
28 |
51 |
10 |
3 |
8 |
79 |
13 |
|
|
1989 Aug 10-13 |
11 |
34 |
29 |
16 |
10 |
45 |
45 |
|
|
1989 Feb 28-Mar 2 |
8 |
41 |
25 |
13 |
13 |
49 |
38 |
|
|
^ |
Asked of half sample |
|||||||
O. Japan
|
Very favor- |
Mostly favor- |
Mostly unfavor- |
Very unfavor- |
No |
Total favor- |
Total unfavor-able |
||
|
% |
% |
% |
% |
% |
% |
% |
||
|
2004 Feb 9-12 |
19 |
56 |
14 |
6 |
5 |
75 |
20 |
|
|
2003 Feb 3-6 |
18 |
59 |
10 |
5 |
8 |
77 |
15 |
|
|
2002 Feb 4-6 |
17 |
62 |
12 |
4 |
5 |
79 |
16 |
|
|
2001 Feb 1-4 ^ |
17 |
56 |
14 |
7 |
6 |
73 |
21 |
|
|
2000 Nov 13-15 |
13 |
57 |
17 |
5 |
8 |
70 |
22 |
|
|
1999 May 7-9 |
14 |
61 |
15 |
5 |
5 |
75 |
20 |
|
|
1999 Feb 8-9 |
15 |
54 |
16 |
5 |
10 |
69 |
21 |
|
|
1996 Mar 8-10 |
12 |
53 |
18 |
7 |
10 |
65 |
25 |
|
|
1995 Nov 6-8 |
4 |
42 |
34 |
11 |
9 |
46 |
45 |
|
|
1994 Jun 11-12 |
6 |
40 |
32 |
12 |
10 |
46 |
44 |
|
|
1994 Feb 26-28 |
7 |
47 |
28 |
14 |
4 |
54 |
42 |
|
|
1993 Jun 29-30 |
7 |
41 |
30 |
16 |
6 |
48 |
46 |
|
|
1992 Feb 6-9 |
9 |
38 |
28 |
22 |
3 |
47 |
50 |
|
|
1991 Nov 21-24 |
7 |
41 |
29 |
12 |
11 |
48 |
41 |
|
|
1991 Mar 14-17 |
10 |
55 |
19 |
7 |
9 |
65 |
26 |
|
|
1991 Jan 30-Feb 2 |
11 |
51 |
21 |
9 |
8 |
62 |
30 |
|
|
1989 Aug 10-13 |
10 |
48 |
23 |
10 |
9 |
58 |
33 |
|
|
1989 Feb 28-Mar 2 |
12 |
57 |
16 |
7 |
8 |
69 |
23 |
|
|
^ |
Asked of half sample |
|||||||
P. Libya
|
Very favor- |
Mostly favor- |
Mostly unfavor- |
Very unfavor- |
No |
Total favor- |
Total unfavor-able |
||
|
% |
% |
% |
% |
% |
% |
% |
||
|
2004 Feb 9-12 |
2 |
23 |
43 |
20 |
12 |
25 |
63 |
|
|
2003 Feb 3-6 |
1 |
17 |
39 |
24 |
19 |
18 |
63 |
|
|
2002 Feb 4-6 |
2 |
13 |
41 |
27 |
17 |
15 |
68 |
|
|
2001 Feb 1-4 ^ |
2 |
9 |
40 |
35 |
14 |
11 |
75 |
|
|
^ |
Asked of half sample |
|||||||
23, continued. Next, I'd like your overall opinion of some foreign countries. First, is your overall opinion of [RANDOM ORDER]very favorable, mostly favorable, mostly unfavorable, or very unfavorable? How about -- [INSERT NEXT ITEM]?
Favorability of Nations Trend (continued)
Q. Mexico
|
Very favor- |
Mostly favor- |
Mostly unfavor- |
Very unfavor- |
No |
Total favor- |
Total unfavor-able |
||
|
% |
% |
% |
% |
% |
% |
% |
||
|
2004 Feb 9-12 |
13 |
55 |
20 |
7 |
5 |
68 |
27 |
|
|
2003 Feb 3-6 |
13 |
61 |
16 |
4 |
6 |
74 |
20 |
|
|
2002 Feb 4-6 |
16 |
56 |
17 |
5 |
6 |
72 |
22 |
|
|
2001 Feb 1-4 ^ |
17 |
50 |
17 |
9 |
7 |
67 |
26 |
|
|
1999 Feb 8-9 |
12 |
43 |
26 |
8 |
11 |
55 |
34 |
|
|
1996 Mar 8-10 |
11 |
46 |
23 |
9 |
11 |
57 |
32 |
|
|
1993 Jun 29-30 |
7 |
36 |
35 |
14 |
8 |
43 |
49 |
|
|
1991 Mar 14-17 |
12 |
53 |
18 |
4 |
13 |
65 |
22 |
|
|
1989 Feb 28-Mar 2 |
7 |
55 |
21 |
6 |
11 |
62 |
27 |
|
|
^ |
Asked of half sample |
|||||||
R. North Korea
|
Very favor- |
Mostly favor- |
Mostly unfavor- |
Very unfavor- |
No |
Total favor- |
Total unfavor-able |
||
|
% |
% |
% |
% |
% |
% |
% |
||
|
2004 Feb 9-12 |
2 |
10 |
42 |
41 |
5 |
12 |
83 |
|
|
2003 Mar 14-15 ^ |
2 |
6 |
33 |
53 |
6 |
8 |
86 |
|
|
2003 Feb 3-6 |
1 |
11 |
38 |
42 |
8 |
12 |
80 |
|
|
2002 Feb 4-6 |
3 |
20 |
38 |
27 |
12 |
23 |
65 |
|
|
2001 Feb 1-4 ^ |
3 |
28 |
37 |
22 |
10 |
31 |
59 |
|
|
2000 Nov 13-15 |
3 |
23 |
41 |
22 |
11 |
26 |
63 |
|
|
^ |
Asked of half sample |
|||||||
S. Pakistan
|
Very favor- |
Mostly favor- |
Mostly unfavor- |
Very unfavor- |
No |
Total favor- |
Total unfavor-able |
|
|
% |
% |
% |
% |
% |
% |
% |
|
|
2004 Feb 9-12 |
3 |
25 |
42 |
22 |
8 |
28 |
64 |
|
2003 Feb 3-6 |
2 |
24 |
42 |
20 |
12 |
26 |
62 |
|
2002 Feb 4-6 |
4 |
26 |
42 |
21 |
7 |
30 |
63 |
|
2000 Mar 17-19 |
2 |
19 |
39 |
20 |
20 |
21 |
59 |
T. Russia
|
Very favor- |
Mostly favor- |
Mostly unfavor- |
Very unfavor- |
No |
Total favor- |
Total unfavor-able |
||
|
% |
% |
% |
% |
% |
% |
% |
||
|
2004 Feb 9-12 |
7 |
52 |
26 |
9 |
6 |
59 |
35 |
|
|
2003 Mar 14-15 ^ |
4 |
37 |
40 |
12 |
7 |
41 |
52 |
|
|
2003 Feb 3-6 |
6 |
57 |
20 |
6 |
11 |
63 |
26 |
|
|
2002 Feb 4-6 |
11 |
55 |
20 |
7 |
7 |
66 |
27 |
|
|
2001 Feb 1-4 ^ |
6 |
46 |
27 |
15 |
6 |
52 |
42 |
|
|
2000 Nov 13-15 |
5 |
35 |
39 |
14 |
7 |
40 |
53 |
|
|
2000 Mar 17-19 |
5 |
35 |
39 |
12 |
9 |
40 |
51 |
|
|
1999 Nov 4-7 |
4 |
34 |
44 |
14 |
4 |
38 |
58 |
|
|
1999 May 7-9 |
4 |
42 |
36 |
13 |
5 |
46 |
49 |
|
|
1999 Apr 13-14 |
3 |
30 |
45 |
14 |
8 |
33 |
59 |
|
|
1999 Feb 8-9 |
6 |
38 |
34 |
10 |
12 |
44 |
44 |
|
|
1997 Nov 21-23 |
7 |
49 |
29 |
7 |
8 |
56 |
36 |
|
|
1996 Mar 8-10 |
6 |
46 |
29 |
10 |
9 |
52 |
39 |
|
|
1995 Apr 21-24 |
5 |
44 |
32 |
12 |
7 |
49 |
44 |
|
|
1994 Feb 26-28 |
8 |
48 |
28 |
11 |
5 |
56 |
39 |
|
|
1992 Feb 6-9 |
12 |
45 |
20 |
13 |
10 |
57 |
33 |
|
|
1991 Nov 21-24 |
7 |
45 |
24 |
12 |
12 |
52 |
35 |
|
|
1991 Aug 23-25 |
9 |
51 |
22 |
9 |
9 |
60 |
31 |
|
|
1991 Aug 8-11 |
11 |
55 |
19 |
6 |
9 |
66 |
25 |
|
|
1991 Mar 14-17 |
6 |
44 |
32 |
10 |
8 |
50 |
42 |
|
|
1991 Jan 30-Feb 2 |
8 |
49 |
26 |
9 |
8 |
57 |
35 |
|
|
1990 Sep 10-11 |
7 |
51 |
23 |
9 |
10 |
58 |
32 |
|
|
1990 May 17-20 |
7 |
48 |
24 |
8 |
13 |
55 |
32 |
|
|
1990 Aug 10-13 |
8 |
43 |
27 |
13 |
9 |
51 |
40 |
|
|
1989 Feb 28-Mar 2 |
7 |
55 |
20 |
9 |
9 |
62 |
29 |
|
|
1989-1992 WORDING: Soviet Union |
||||||||
|
^ |
Asked of half sample |
|||||||
U. Saudi Arabia
|
Very favor- |
Mostly favor- |
Mostly unfavor- |
Very unfavor- |
No |
Total favor- |
Total unfavor-able |
||
|
% |
% |
% |
% |
% |
% |
% |
||
|
2004 Feb 9-12 |
3 |
25 |
47 |
19 |
6 |
28 |
66 |
|
|
2003 Feb 3-6 |
3 |
27 |
41 |
20 |
9 |
30 |
61 |
|
|
2002 Feb 4-6 |
4 |
23 |
42 |
22 |
9 |
27 |
64 |
|
|
2001 Feb 1-4 ^ |
7 |
40 |
28 |
18 |
7 |
47 |
46 |
|
|
1991 Aug 8-11 |
11 |
45 |
21 |
12 |
11 |
56 |
33 |
|
|
^ |
Asked of half sample |
|||||||
V. The Palestinian Authority
|
Very favor- |
Mostly favor- |
Mostly unfavor- |
Very unfavor- |
No |
Total favor- |
Total unfavor-able |
||
|
% |
% |
% |
% |
% |
% |
% |
||
|
2004 Feb 9-12 |
2 |
13 |
44 |
32 |
9 |
15 |
76 |
|
|
2003 Feb 3-6 |
1 |
12 |
44 |
29 |
14 |
13 |
73 |
|
|
2002 Feb 4-6 |
3 |
11 |
44 |
32 |
10 |
14 |
76 |
|
|
2001 Feb 1-4 ^ |
4 |
18 |
39 |
24 |
15 |
22 |
63 |
|
|
2000 Jan 25-26 |
3 |
18 |
36 |
16 |
27 |
21 |
52 |
|
|
^ |
Asked of half sample |
|||||||
