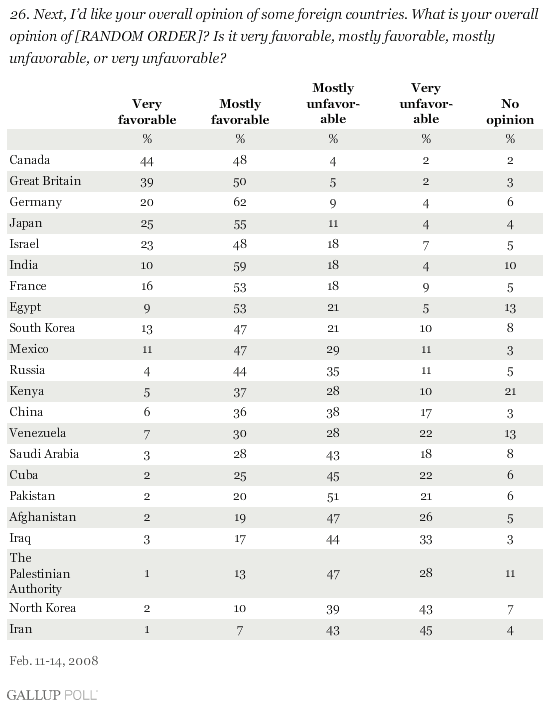
PRINCETON, NJ -- Of 22 countries rated in Gallup's 2008 World Affairs survey, Canada, Great Britain, Germany, and Japan win favor with at least 80% of Americans, while Iraq, the Palestinian Authority, North Korea, and Iran are viewed favorably by no more than 20%.
Canada and Great Britain have topped Gallup's country rankings each of the 12 times since 1989 that both countries have been measured, although in most cases Canada has led Great Britain by a few percentage points. The only other country to approach 90% favorability over the years has been Australia. On each of the three occasions it was included in Gallup's country list, including last year, it ranked just as high as Great Britain.
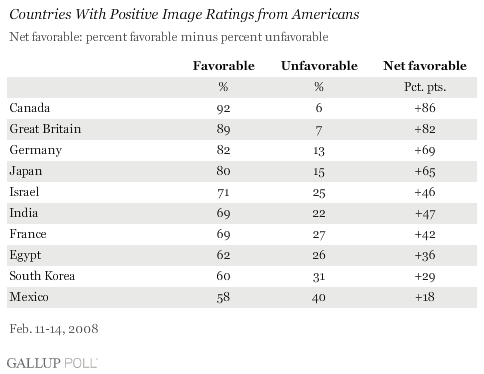
Altogether, 10 countries rated in the Feb. 11-14, 2008, poll are viewed favorably by a majority of Americans. Following the top four, Israel receives a 71% favorable rating, similar to the 69% for both India and France. About 6 in 10 Americans have a favorable view of Egypt, South Korea, and Mexico.
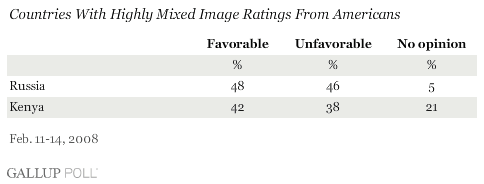
Americans are about equally divided in their views of Russia and Kenya, with a fairly large percentage (21%) having no opinion of Kenya.
Ten countries are viewed unfavorably by at least half of Americans. Of these, Iran, North Korea, the Palestinian Authority, Iraq, Afghanistan, Pakistan, and Cuba are viewed more negatively than positively by a greater than 2-to-1 margin. Saudi Arabia, Venezuela, and China have somewhat more moderately negative images.
Notable Differences
ÆéûÜǨû§finds some significant generational and partisan gaps in favorability toward some countries.
- Israel, Saudi Arabia, Afghanistan, Pakistan, and Iraq are all viewed more favorably by Republicans than by Democrats.
- France, Mexico, China, Venezuela, and Cuba are all viewed more favorably by Democrats than by Republicans.
- Two of the starkest demographic distinctions in survey ratings are age differences in perceptions of Russia and China. About 6 in 10 young adults (those aged 18 to 34) have a favorable view of these countries, compared with no more than half of middle-aged adults and only about a third of those 55 and older.
- Younger adults are also more likely than those 55 and older to have favorable views of France, Egypt, Mexico, Kenya, Venezuela, Cuba, the Palestinian Authority, North Korea, and Iran.
Survey Methods
Results are based on telephone interviews with 1,007 national adults, aged 18 and older, conducted Feb. 11-14, 2008. For results based on the total sample of national adults, one can say with 95% confidence that the maximum margin of sampling error is ôÝ3 percentage points.
Interviews are conducted with respondents on land-line telephones (for respondents with a land-line telephone) and cellular phones (for respondents who are cell-phone only).
In addition to sampling error, question wording and practical difficulties in conducting surveys can introduce error or bias into the findings of public opinion polls.
